The Release Clock
The models will ship daily long before the world can absorb them weekly.

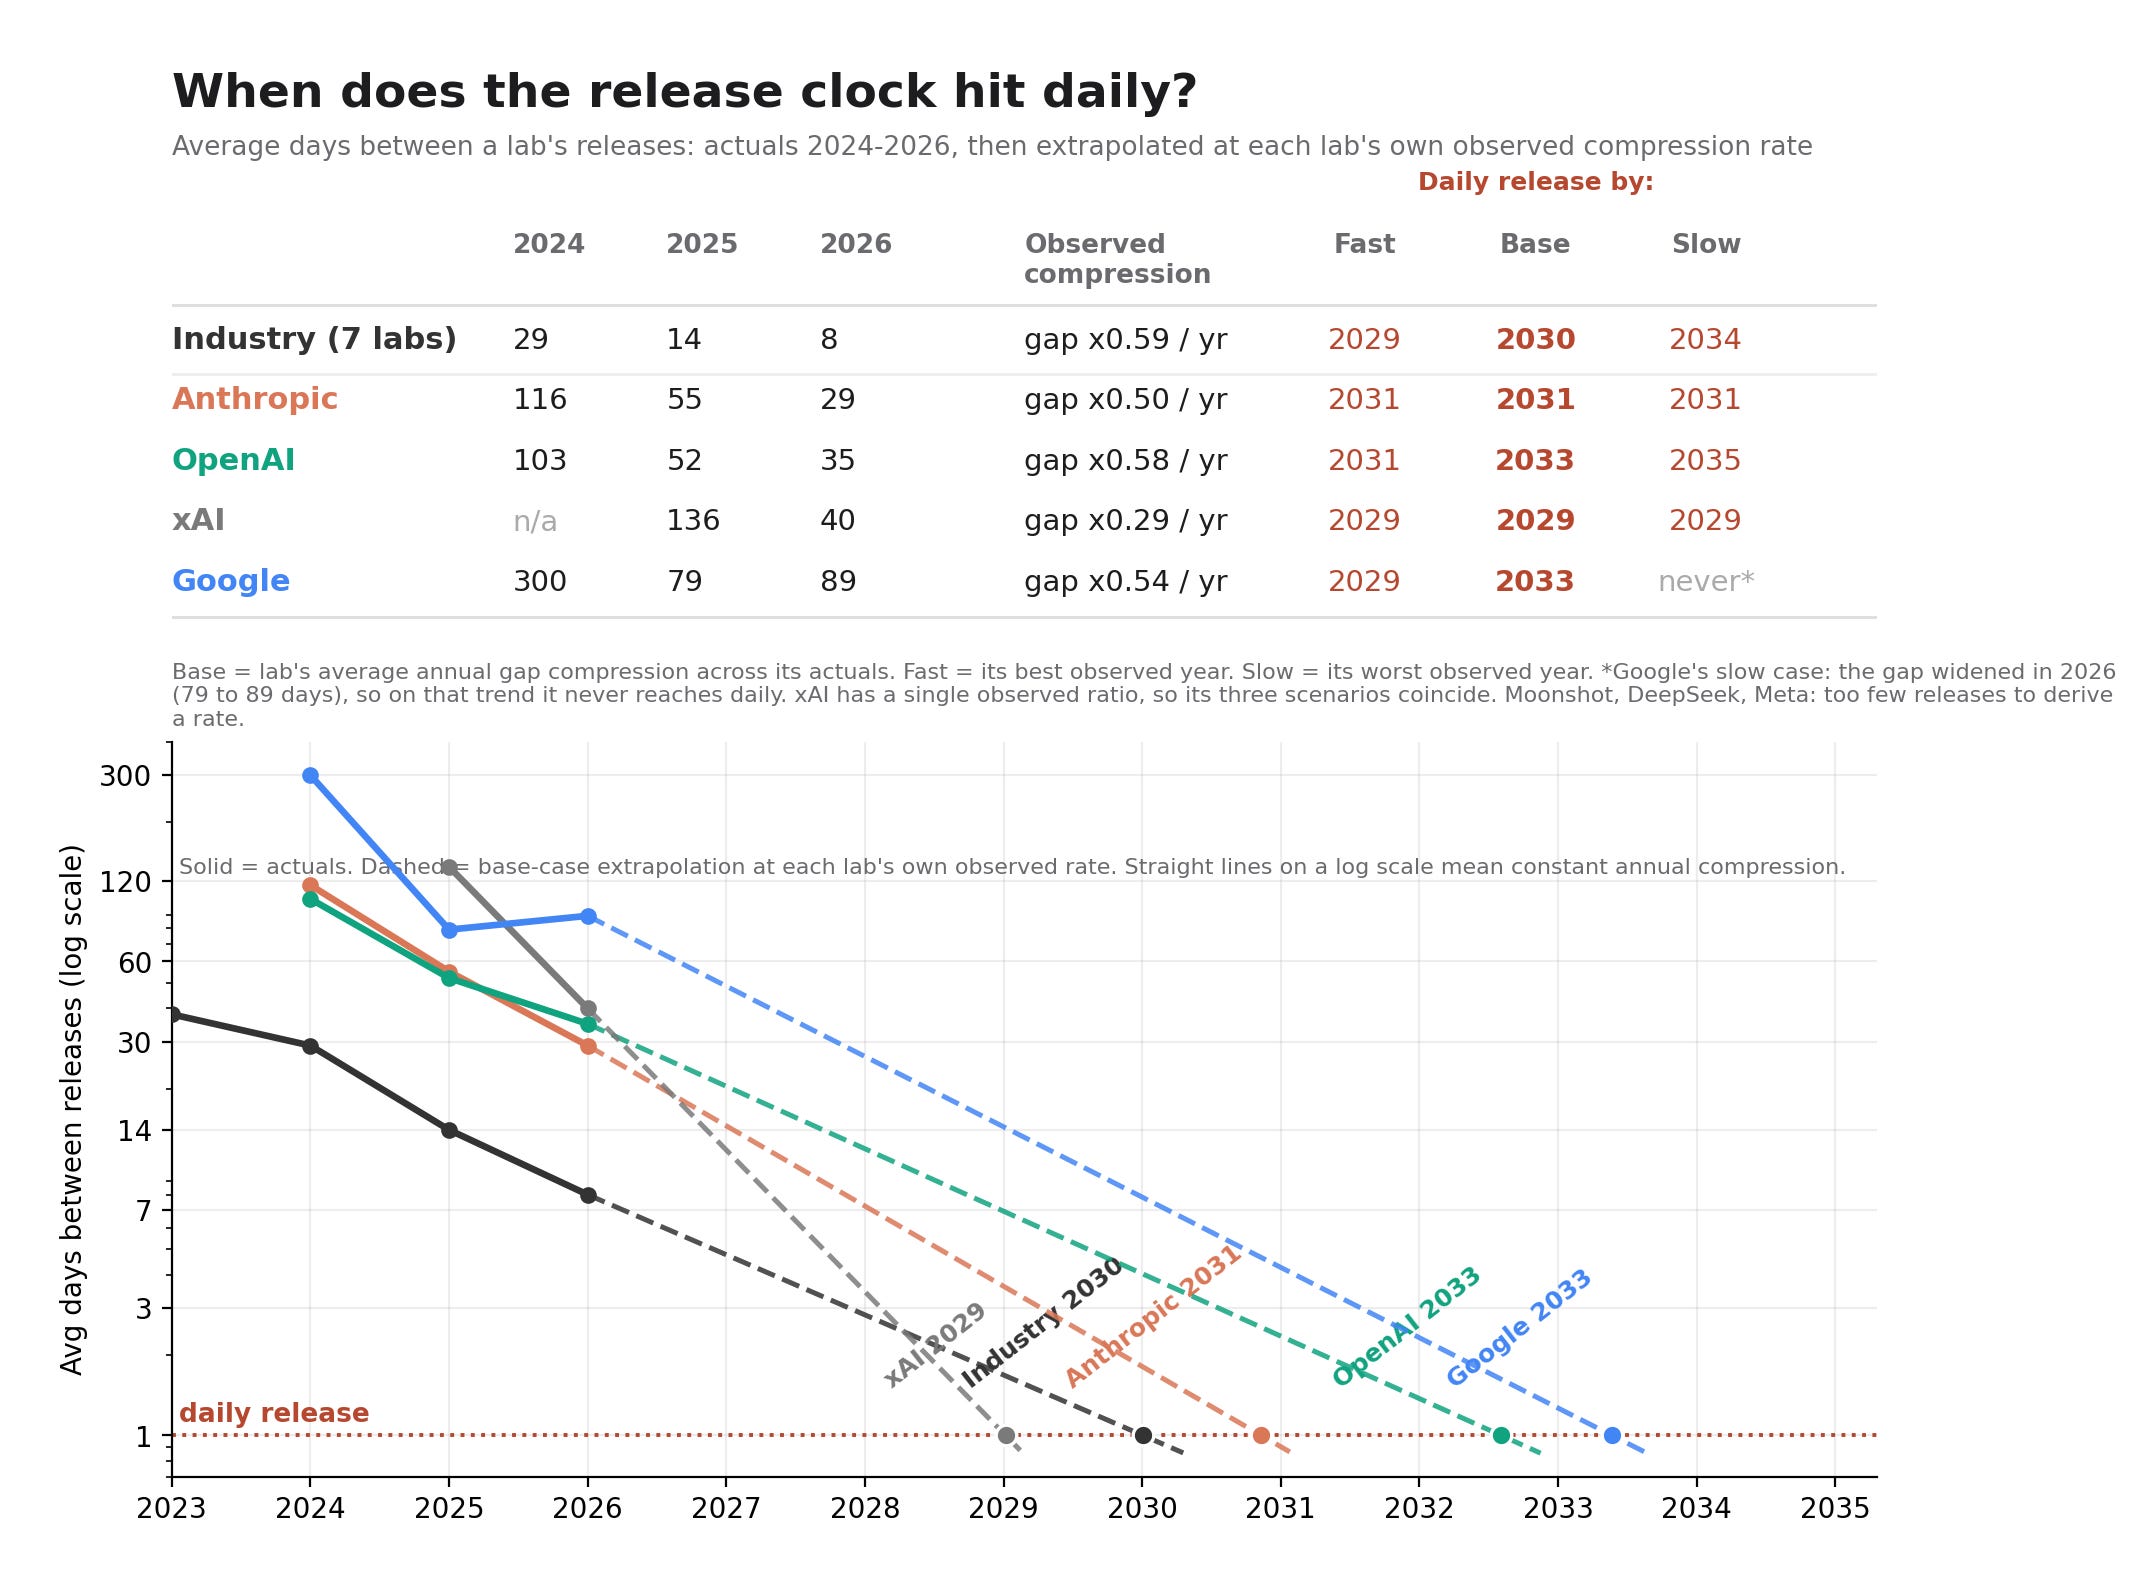
In 2023, the major AI labs shipped a frontier model every 38 days. In 2024, every 29 days. In 2025, every 14. So far in 2026, every 8. Run the trend forward and a new frontier model ships every single day by 2029.
Half of that paragraph is measurement and half of it is a trap. This piece pulls the release date of every flagship model from the major labs since GPT-4, measures the days between them, and works through three questions. Is the acceleration real once you look at individual companies instead of the industry firehose? How do you tell whether the models are actually getting better with each release, when the benchmarks they are graded on keep maxing out? And if capability really does start compounding on a daily clock, what happens to the economics of knowledge work?
The short answers: yes with a catch, task horizon beats benchmarks, and anyone who sells hours has a margin problem. The long answers follow.
The gap is halving
Start with the before picture. OpenAI waited 29 months between GPT-3 and GPT-4. That was the old rhythm: a flagship every few years, each one an event.
The analysis below starts in March 2023, when GPT-4 shipped and the modern release era began. That is also when every major lab has comparable data. Anthropic’s first Claude landed the same month, and the rest of the field filled in behind them.
The compression since then has been relentless. Counting flagship text and reasoning releases from seven major labs (OpenAI, Anthropic, Google, xAI, Meta, DeepSeek, Moonshot), 2023 saw 8 releases averaging 38 days apart. 2024 brought 12 releases, 29 days apart. 2025 doubled to 24 releases, 14 days apart. And the first half of 2026 has already produced 23 releases with an average gap of 8 days and a median of 7.
The sequence is 38, 29, 14, 8. A gap measured in years collapsed into a gap measured in days over three years, and the interval keeps roughly halving annually. Extend that curve and the industry crosses the daily threshold around 2029.
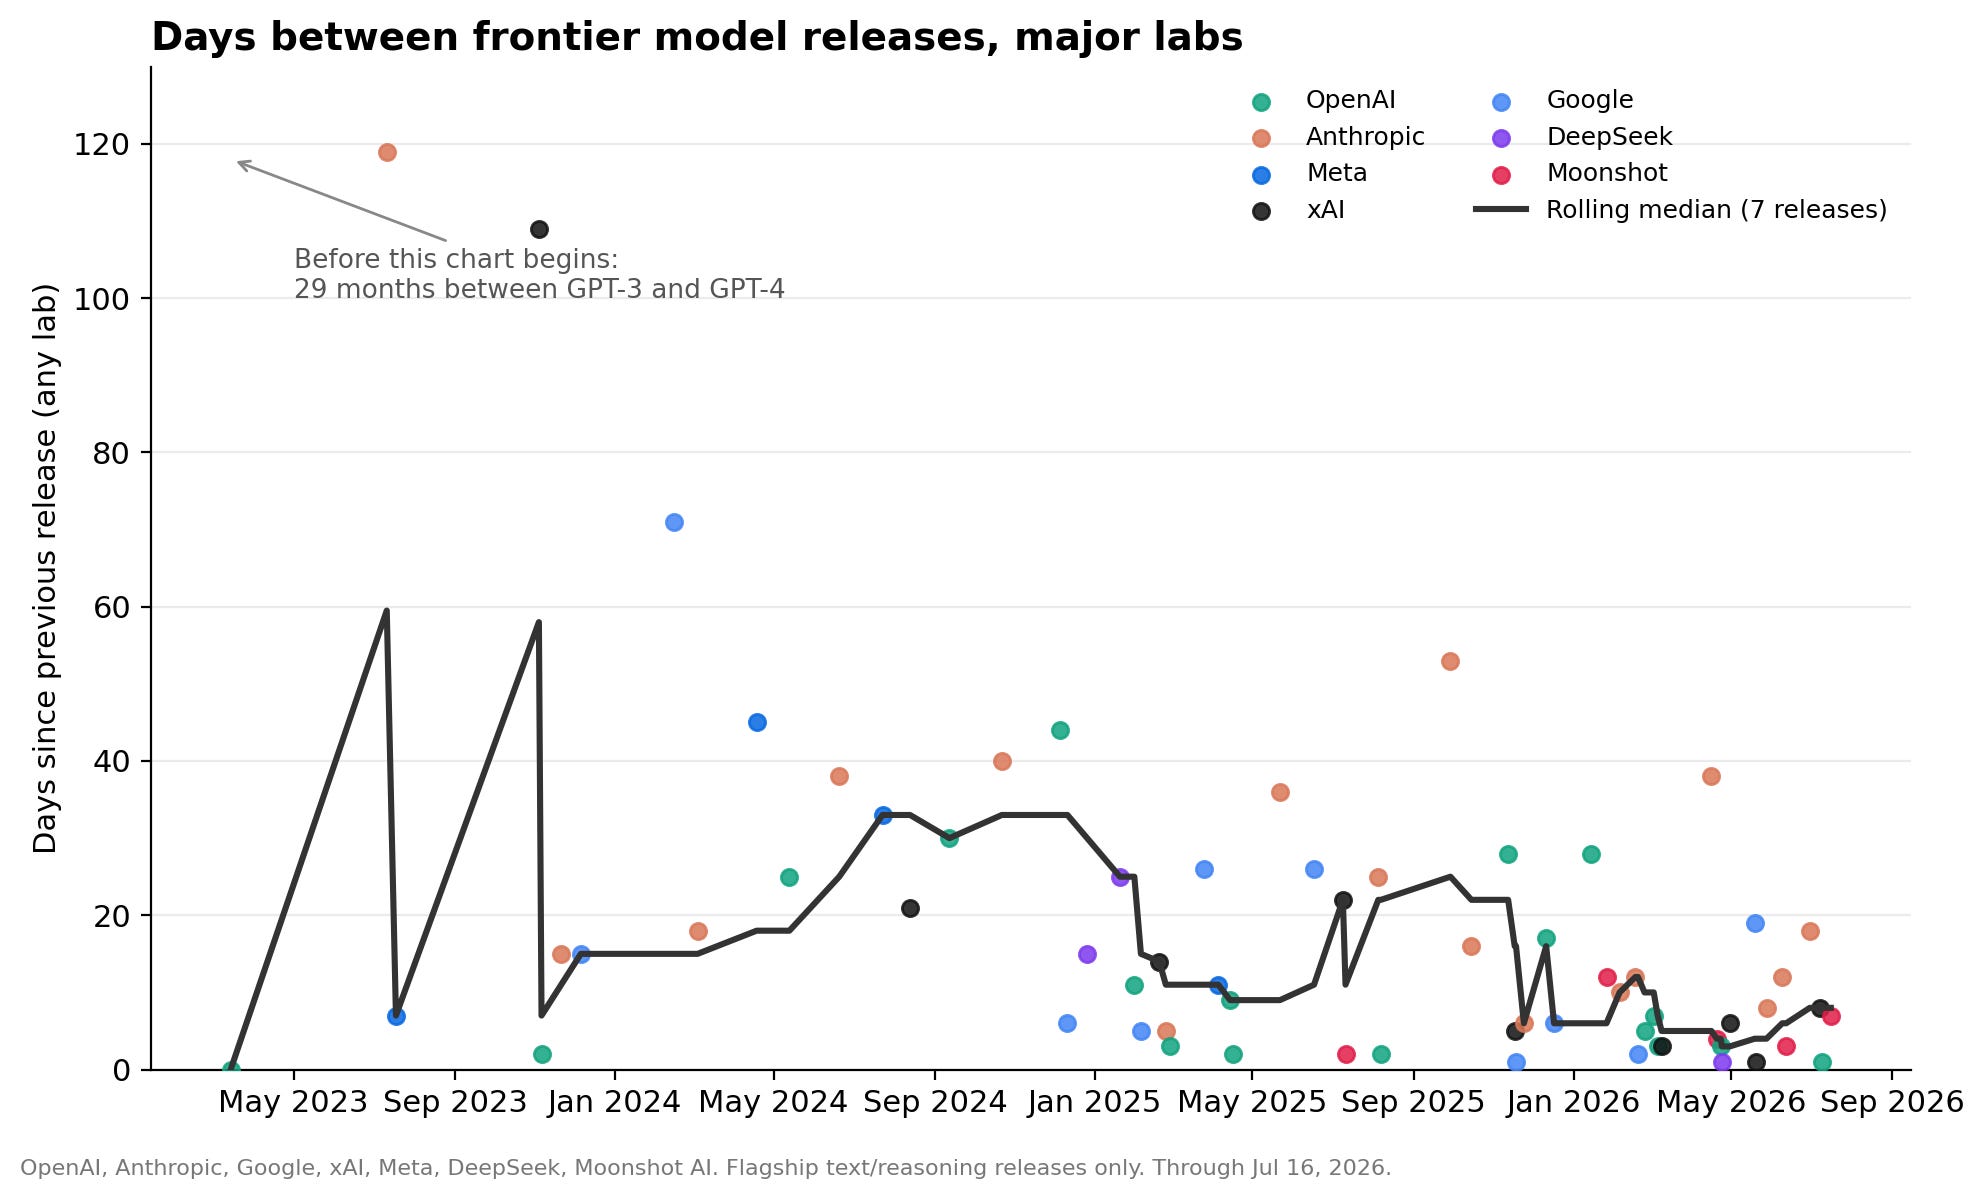
Before you extrapolate, look closer. That industry-level firehose is largely a composition effect. More labs entered the race. OpenAI, Google, Anthropic, xAI, Meta, DeepSeek, Mistral, Moonshot. When eight companies each ship every one to two months, the combined stream looks daily even though no single lab is close.
The company-level numbers tell a calmer story.
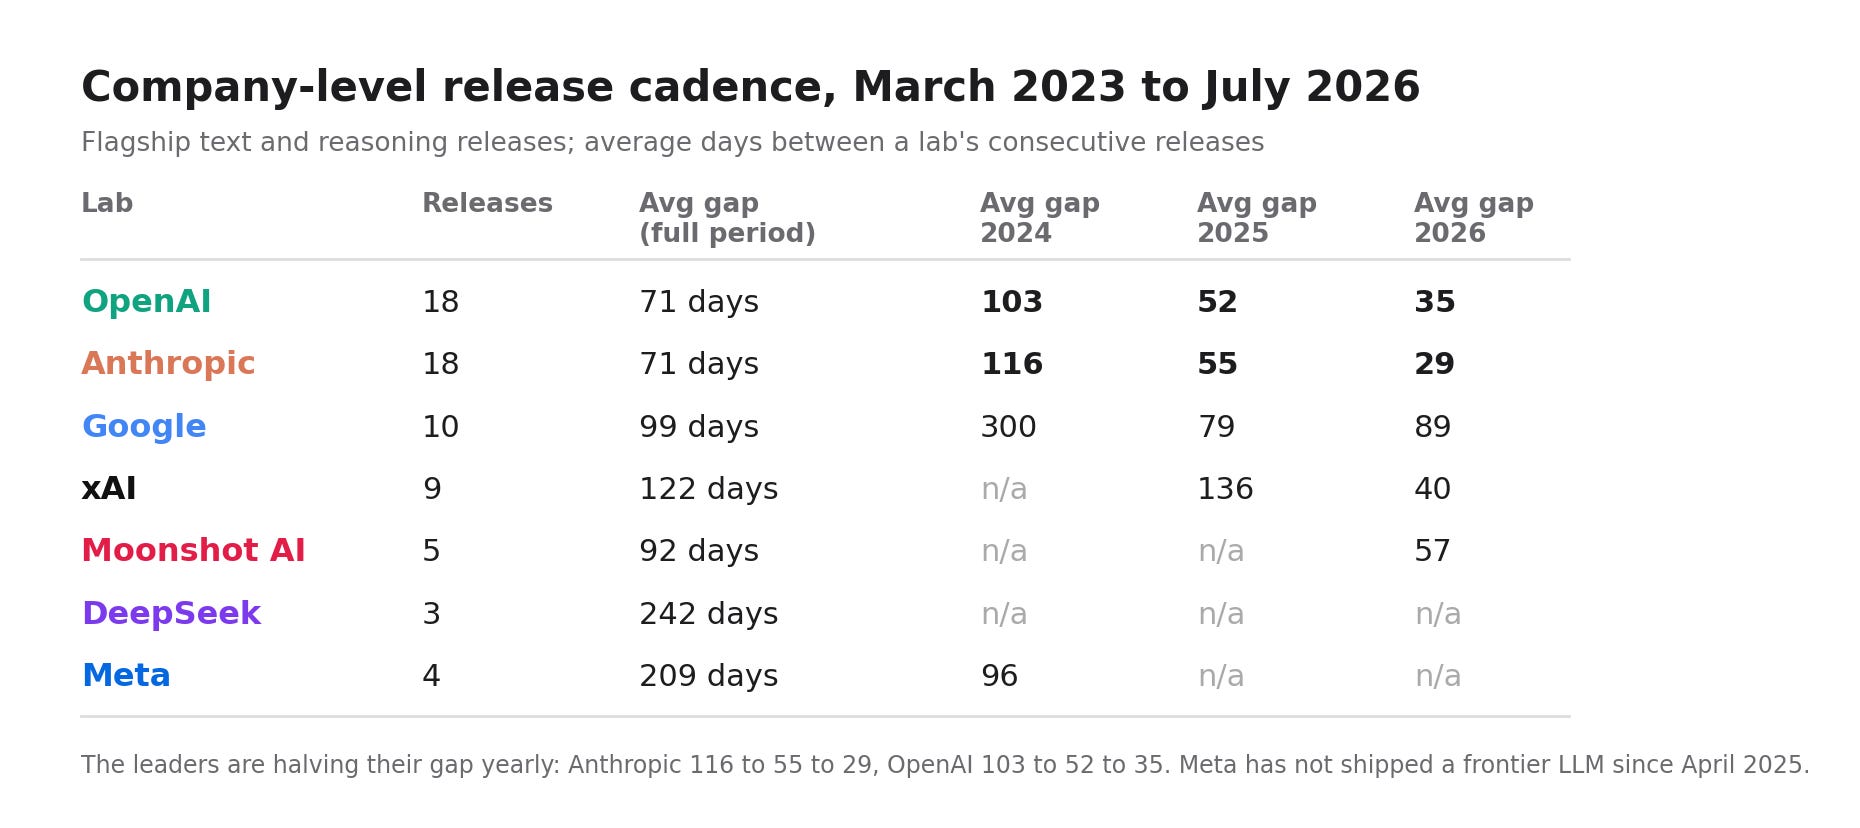
Read the OpenAI and Anthropic rows left to right. Anthropic went from a 116-day average gap in 2024, to 55 in 2025, to 29 so far in 2026. OpenAI went 103, 52, 35. That is a clean halving, year over year, at the individual lab level. The two leaders now ship a major model roughly monthly, while nobody in the field is anywhere near daily.
The table also shows what falling behind looks like. Meta has not shipped a frontier language model since Llama 4 in April 2025, fifteen months and counting.
If a frontier lab keeps compressing its gap at its own observed rate, the runway is longer than the headlines suggest. The hero visual at the top runs the extrapolation from each lab’s actuals rather than a generic halving assumption. Anthropic, the only lab with a clean 50 percent compression rate two years running, crosses daily around 2031 in all three of its scenarios. OpenAI’s observed rate is gentler, so its base case lands in 2033. Google’s actuals cut both ways: its fast year would put it at 2029, but its gap actually widened in 2026, and on that trend it never gets there. The industry as a whole crosses first, around 2030, because the streams stack. Five-year runways, not one.
Even that projection deserves skepticism. The last halving came partly from a one-time unlock: labs stopped saving everything for an annual flagship and started shipping point releases and mid-cycle bumps. You can only discover “ship smaller increments more often” once. The next halving needs a new mechanism, like faster training runs or research that automates itself.
Competition keeps the pressure on either way. This industry runs on Red Queen dynamics. Any lab that slows its cadence watches its API revenue walk across the street within a quarter. Nobody can afford to be the slow one, so the pace holds even if the halving softens.
Frequency is the wrong metric anyway
Here is where most takes on this topic go wrong. Release frequency by itself is marketing noise. If labs ship weekly but each release is a rounding error, nothing has accelerated except the press cycle.
The signal worth watching combines two things: the gap between releases keeps shrinking, and the capability jump per release holds steady. Both together mean intelligence is genuinely compounding. Either one alone means much less.
Which raises the harder question: how do you measure the jump per release?
Benchmarks are the common language, so use them. But recognize their two failure modes. First, they saturate. A model sitting at 90 percent on a test cannot keep gaining half a point per release, and the last few points are brutally harder than the first fifty. Second, the goalposts move. Every time a benchmark maxes out, the field invents a harder one, which makes cross-year comparison nearly meaningless.
The better axis is task horizon: the length of task, measured in human working time, that a model can complete autonomously and reliably. That number has been doubling roughly every seven months. Models went from handling seconds of work, to minutes, to multi-hour coding and research jobs where they catch and correct their own errors. Unlike a benchmark score, task horizon has no visible ceiling. Can the model do a week of unsupervised work? A month? The axis keeps stretching after every test in the multiple-choice era has been retired.
Task horizon is harder to measure cleanly. It needs consistent task suites and an agreed definition of success, and labs cherry-pick. It is still the right axis, because it maps to the question that actually matters: how does the model compare to a human doing the same job?
Task horizon is harder to measure cleanly. It needs consistent task suites and an agreed definition of success, and labs cherry-pick. It is still the right axis, because it maps to the question that actually matters: how does the model compare to a human doing the same job?
Three lanes for the compounding math
Suppose the industry hits a daily cadence around 2029, on trend, and each release adds a small capability gain. The compounding math splits into three lanes.
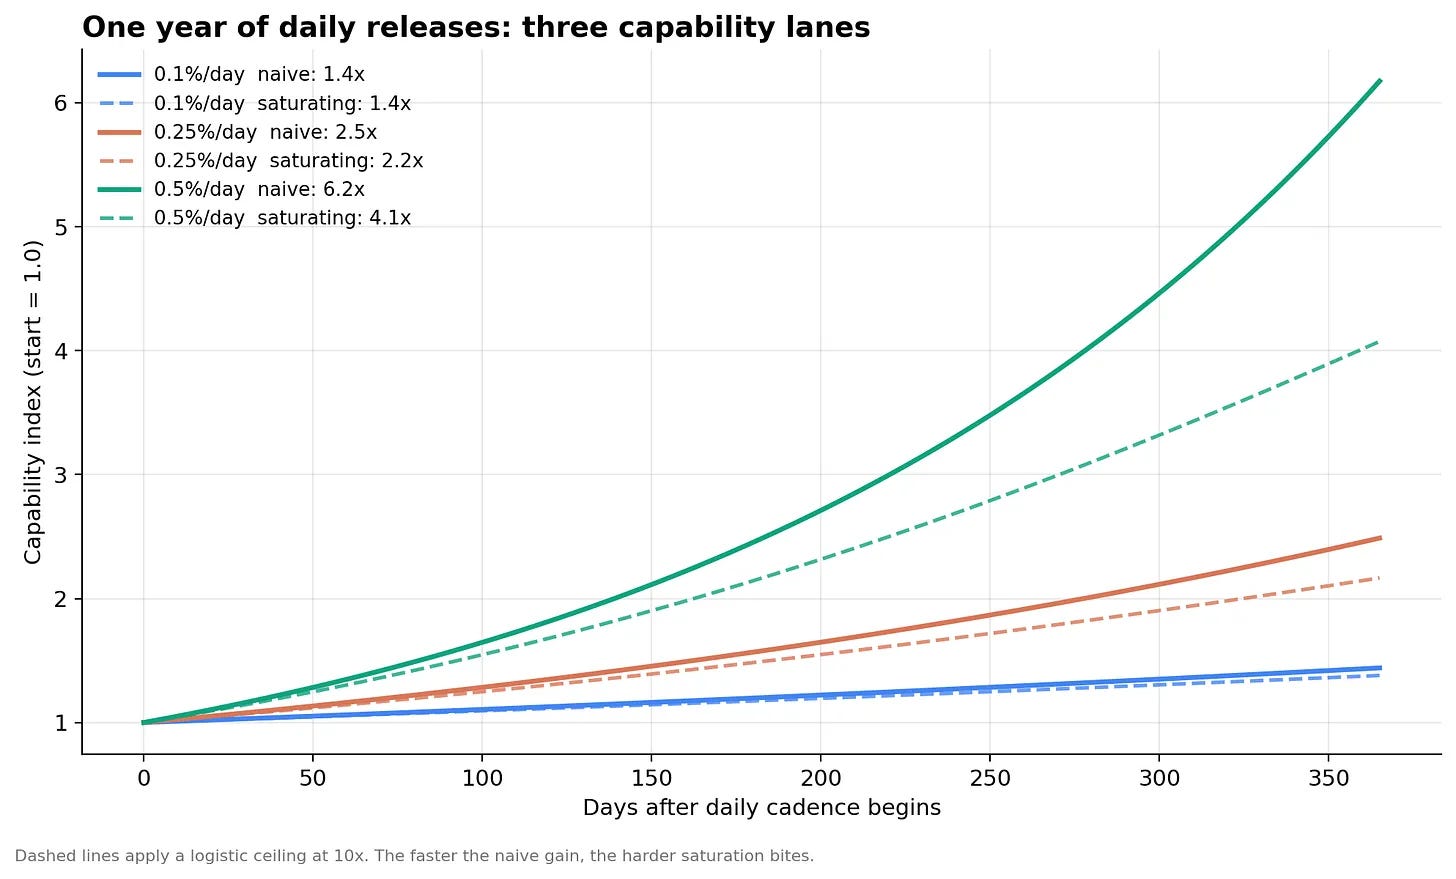
Now add saturation. Run the same lanes against a capability ceiling and the aggressive lane drags from 6.2x down to about 4x, while the slow lanes barely move. The faster the apparent gain, the harder the ceiling bites. My honest money is on the middle lane bending into an S-curve: two to three times per year, sustained, which is still historically absurd.
Whether the ceiling wins depends on one question. Does each release make the next release easier? If better models genuinely accelerate the research that builds better models, the loop is real and the exponential holds. If gains keep coming mainly from more compute and more data, the curve runs into power, chips, and capital. I wrote about those slow-growing physical constraints in The Sequoia Curve; the bottlenecks that grow at 1.2x per year eventually govern the system that wants to grow at 4x.
The second-order story
Take the middle lane seriously and follow the money.
If task horizon keeps doubling every seven months, today’s multi-hour autonomy becomes multi-day autonomy by the end of next year. At that point the unit economics of knowledge work flip. A completed task starts pricing like compute instead of billable hours. That quietly guts the margin structure of anyone who sells hours: consulting, legal, agencies, and basically every other corporate field.
Value then migrates from producing work to verifying it. When output is nearly free, the scarce inputs are judgment, accountability, and taste. Who signs off. Who is liable. Who has the relationship. Whoever owns verification and distribution captures the surplus.
Org charts thin in the middle, where coordination and first drafts live. Tiny teams start wielding big-company output, and firm sizes barbell: hyper-leveraged small builders on one end, mega-platforms on the other, the middle squeezed.
For individuals, the skills that appreciate are orchestration, verification, and domain taste. The skill that depreciates is raw production speed.
The caveat that matters most
Capability does not equal adoption. By the time models ship daily, the bottleneck will have nothing to do with model quality. It will be data access, permissions, trust, regulation, and plain organizational inertia. Economic impact trails the capability curve by years, which is exactly why the daily-release headline overstates the felt change.
That gap is the real story. The release clock is speeding up on one side of it, and the absorption clock barely moves on the other. Watch the shrinking gap between releases. Watch the capability jump per release, measured in task horizon. And remember that the models will ship daily long before the world can absorb them weekly. TLDR — If it feels fast now, just wait, it will get faster.
Methodology: 67 flagship text and reasoning model releases from OpenAI, Anthropic, Google, xAI, Meta, DeepSeek, and Moonshot AI, March 14, 2023 (GPT-4 and Claude 1) through July 16, 2026 (Kimi K3). Image, video, and embedding models excluded; same-day family launches counted once. Dates verified against provider announcements and the LLM Gateway release timeline. Widening the net to Alibaba, Mistral, Z.AI, and MiniMax shrinks the industry gaps further, which is the composition effect in action. Charts and tables: hero_daily_extrapolation.png (hero, after the intro; also the social card), chart1_cadence.png and table_company_cadence.png (insert in "The gap is halving"), table_lanes.png and chart2_scenarios.png (insert in "Three lanes").