How to Value a Technology That Does Not Exist Yet
A first-principles valuation of Figure's package-sorting robots, and the intern who beat them

In May, Figure put its humanoid robots on a package-sorting line and livestreamed it. The run began as what its CEO billed as a “Man vs. Machine” challenge: 10 hours, one robot against one human intern. The intern won, narrowly.1 Then what was planned as an eight-hour demonstration kept going for 200 hours, autonomously, with no reported failures and no humans in the loop.2
The reaction split into two camps. A small one saw the end of warehouse labor. The much larger one saw a robot lose to an intern and turned it into a punchline about how overhyped robotics is. I think that camp is wrong in an expensive way, and this piece shows why with numbers rather than adjectives.
A technology still mid-demo has no price sheet, clear installed base, and no long term metrics, so comparables do not exist (lets put aside other humanoid robotic products as well, as this industry is still young). What remains is a first-principles valuation: define the unit of output, price every input, and build the economics from the task up. The unit of output in this example is easy: a sorted package. Figure and package sorting are the worked example because the company just ran its experiment in public and the clips drew press; the framework is specific to neither. It applies to any repetitive task with a countable unit of output, and to any platform in the humanoid race, Tesla, Agility Robotics, Unitree, 1X, and Boston Dynamics among them. The purpose of this post is to share the calculations and math behind quantifying this type of investment; and is not a recommendation for or against. But rather a demystifying of the process of potential financial evaluation and justification.
The sprint is the wrong race
The challenge is worth taking seriously, because it measured something real: over ten hours on identical work, human and robot finished within 1.5% of each other. What the viral posts skipped is what happened when the shift ended: the intern went home, and the robots kept sorting for another eight days.
That difference is the entire valuation. A one-shift challenge measures rate, but a business buys output, which is rate multiplied by operating hours. The robot gives up 1.5% on rate and gets back three shifts of hours a day, so the interesting question was never who sorted faster; it is what a machine that never clocks out is worth, and the rest of this piece prices it.
Step 1: Anchor every rate to the demo
Every rate in this model comes from the same line, the same task, and the same week, as clean as anchors get for a technology this young.

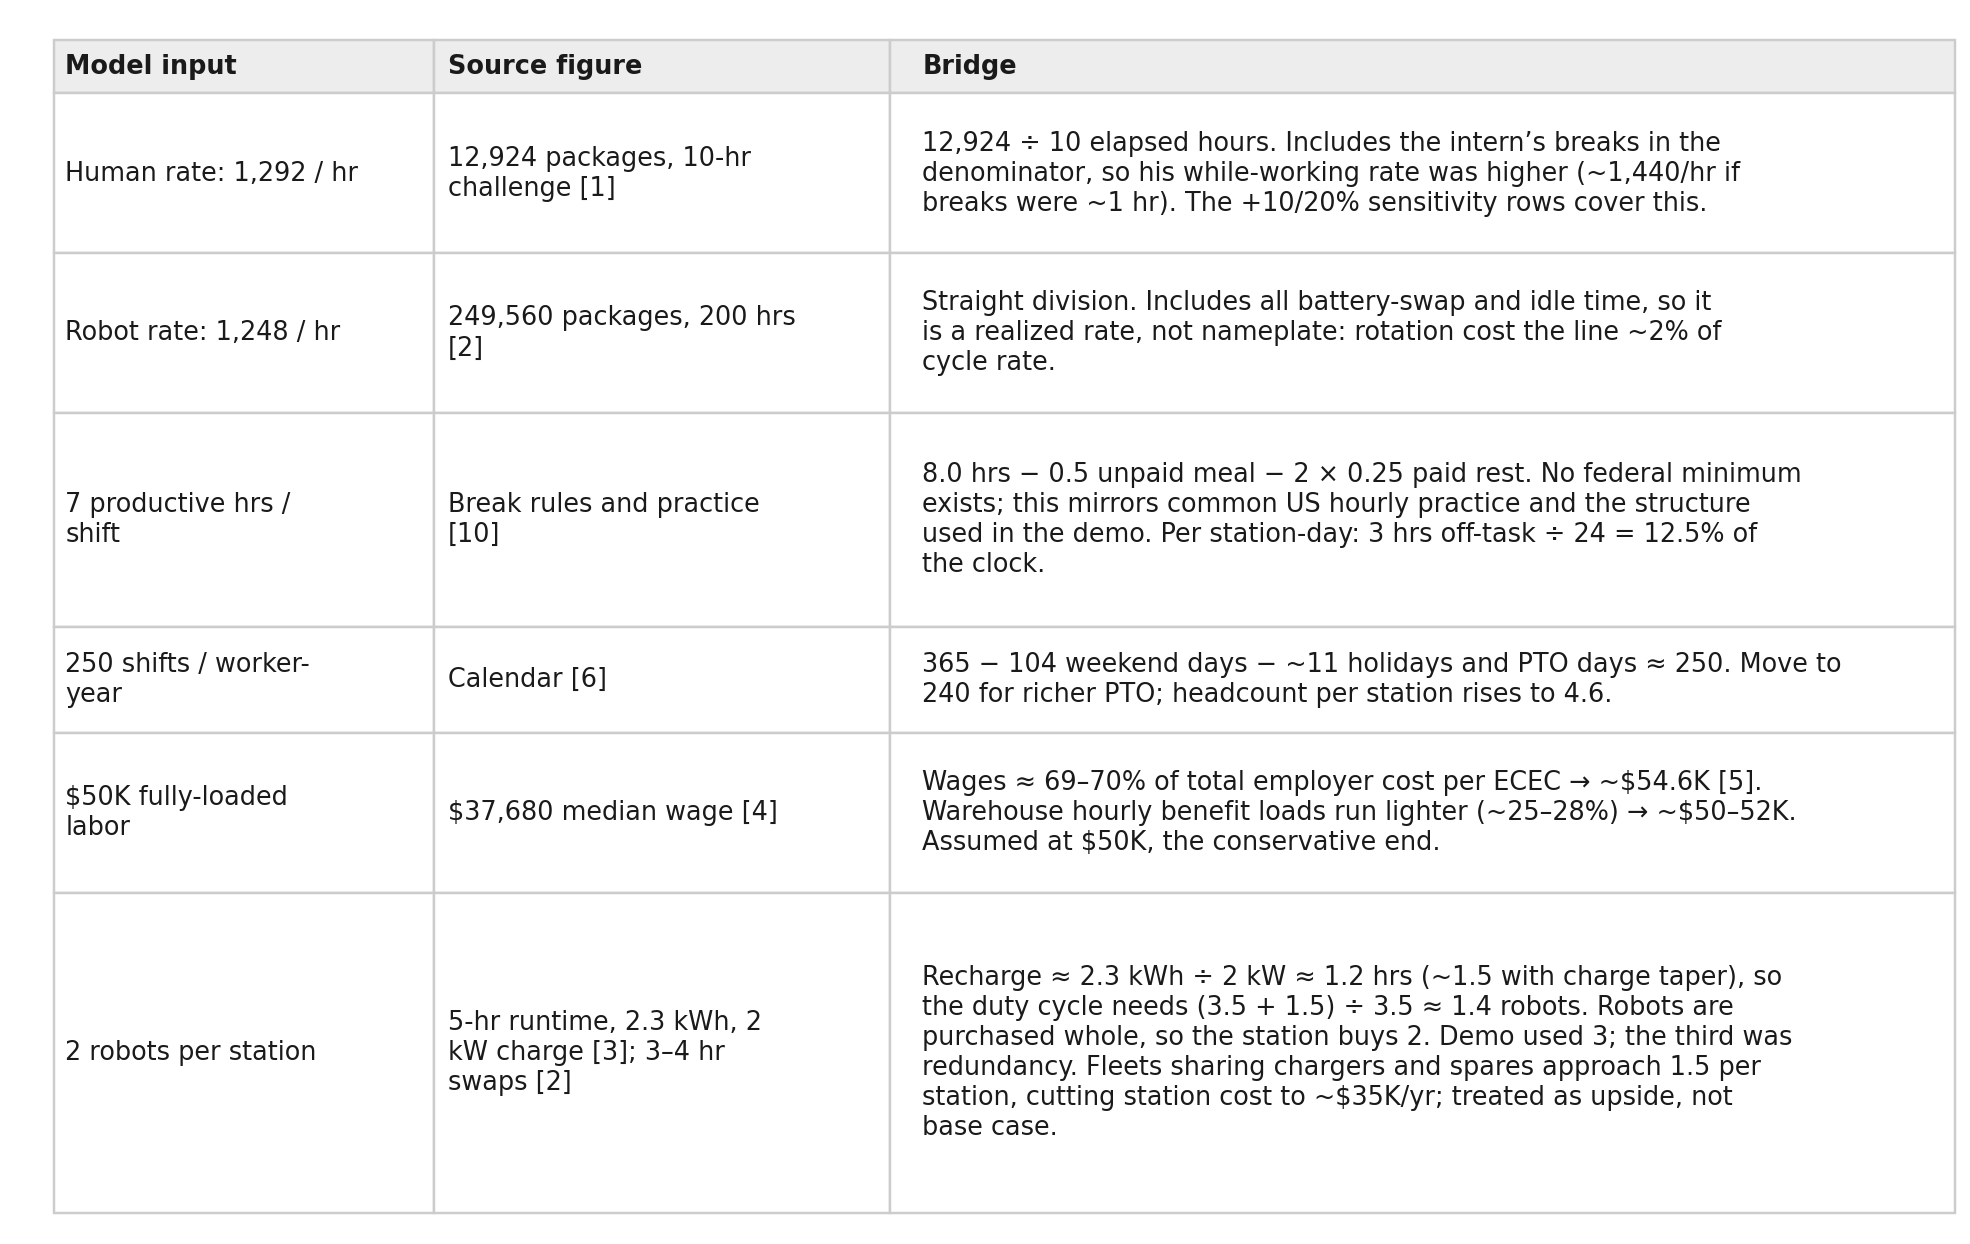
The 200-hour figure matters most. The robots covered battery swaps by rotation, a walk-off, walk-on handoff, and still averaged within 2% of their cycle rate across the full run.3 My first instinct was to haircut that rate for the usual real-world leakage, re-grips, exceptions, idle time, but the run itself argued back: all of it, measured across 200 hours, cost about 2%. What a demo line cannot tell us about a live facility, I hold for the risks and opportunities at the end.
Step 2: Price the inputs
Price both sides first. Everything downstream builds from the four figures here.
A shift of labor: $200. The median wage for hand laborers and material movers is $37,680.4 Benefits, payroll taxes, workers’ compensation, and supervision gross the employer’s true cost up to between $50,000 and $54,600.5 I assume $50,000 fully loaded: $200 per shift across a 250-shift year (built in Step 4).
Robots per station: 2. Demo robots swapped every three to four hours, and recharging takes about 1.5 hours, so the duty cycle needs 1.4 robots. Robots are purchased whole: a station buys two. Figure ran three, but physics only requires two; the third was redundancy. Fleet-scale sharing approaches 1.5 per station; treat that as upside.6
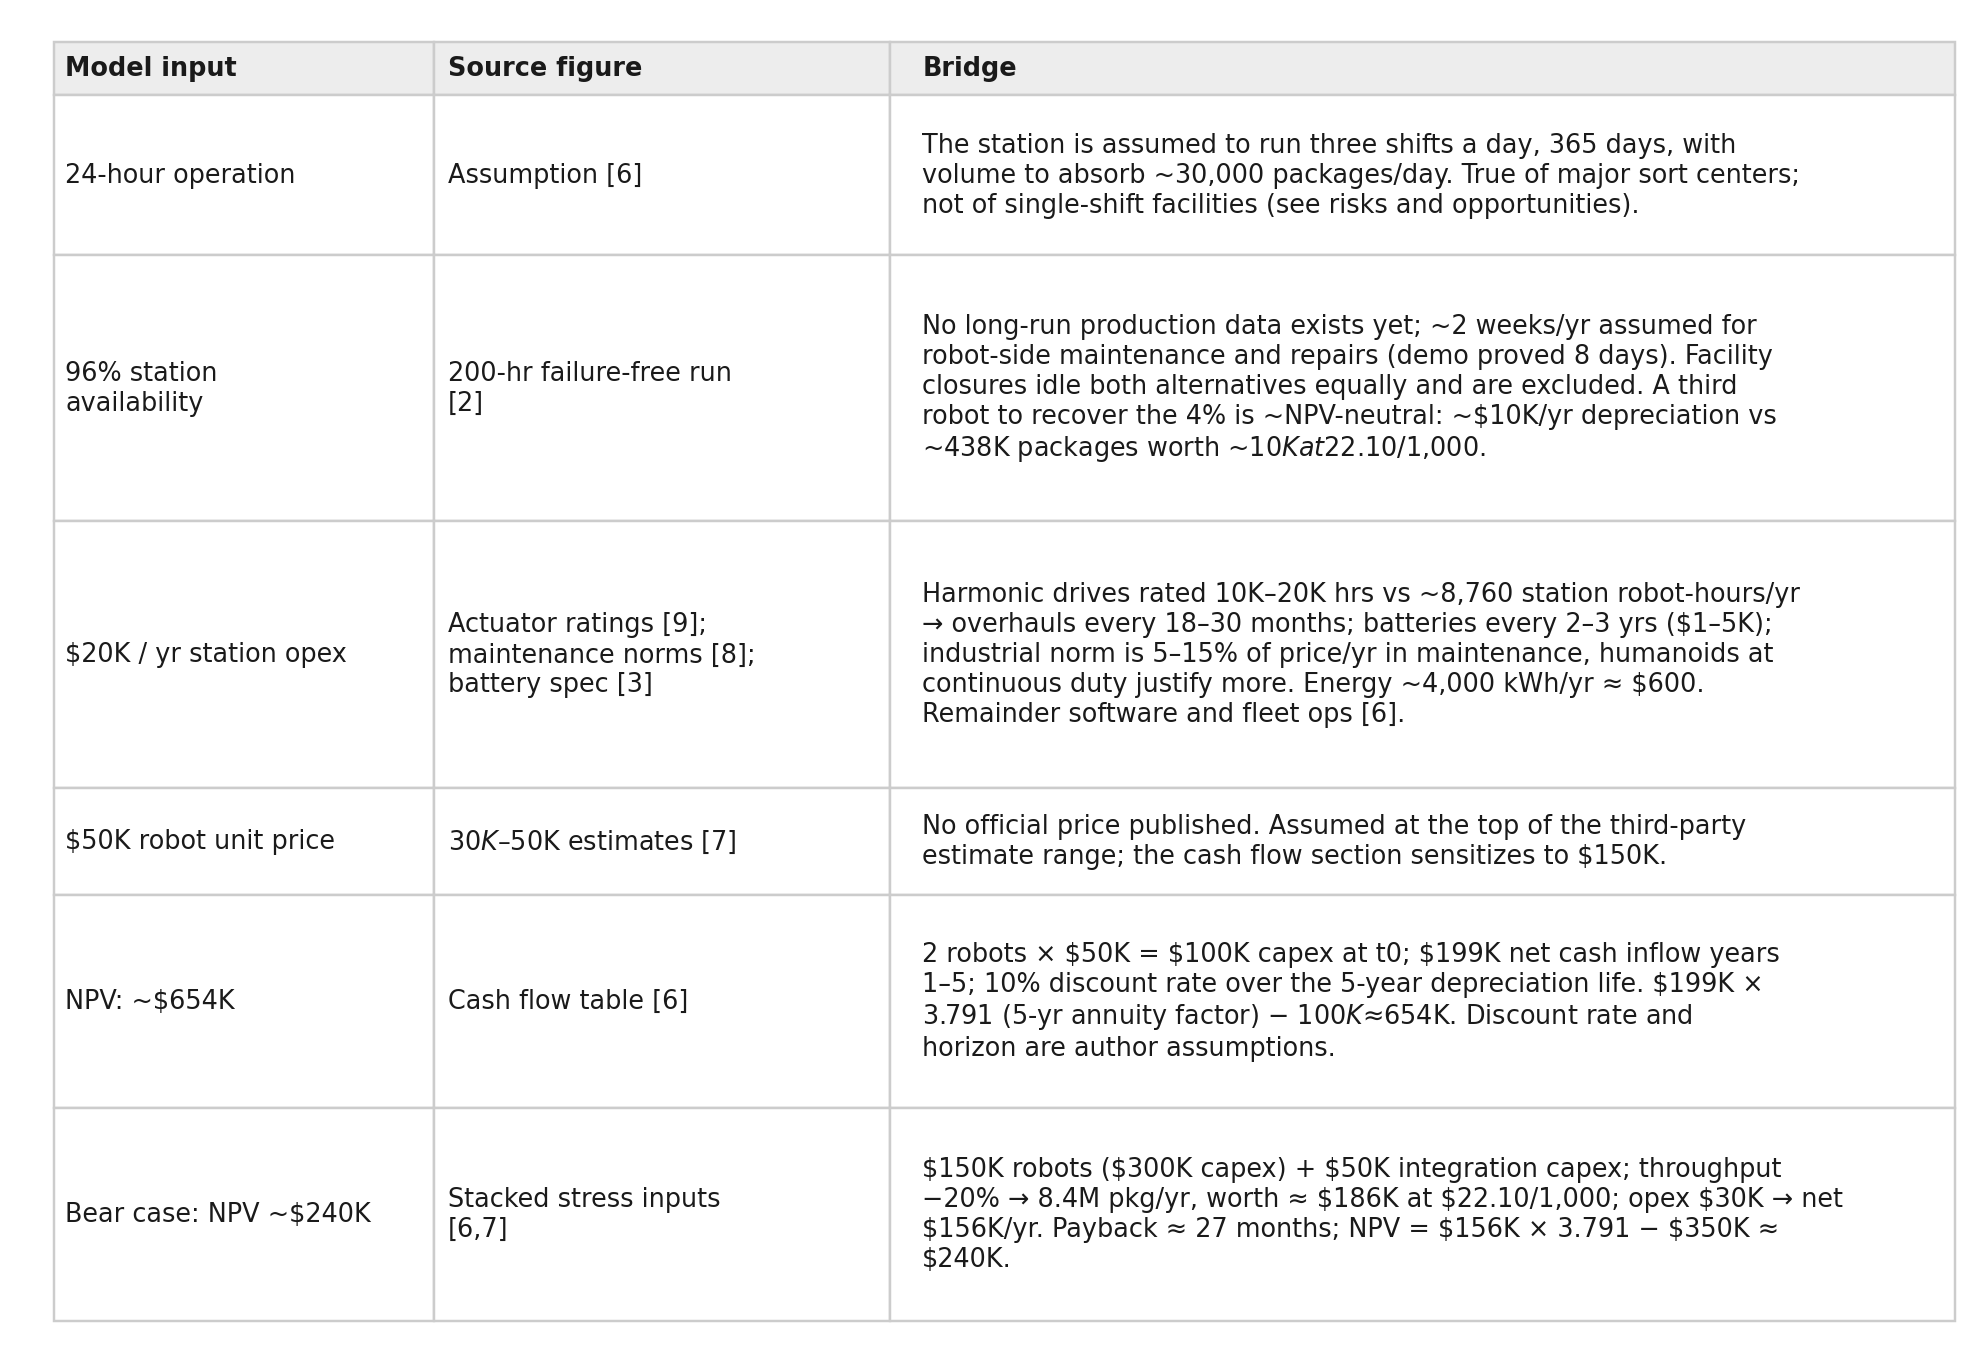
Capital: $20,000 a year. Figure has not published a price; 2026 estimates put F.03 units at $30,000 to $50,000, and I take the top.7 Two robots at $50,000 over a five-year life is $20,000 of annual depreciation.
Operating cost: $20,000 a year, and most of it is wear. A humanoid runs 30-plus joints on harmonic drives rated for 10,000 to 20,000 hours, against about 8,760 station robot-hours a year, so actuator overhauls come every 18 to 30 months.89 Add batteries every two to three years, service, software, and fleet operations; electricity is a rounding error. All-in: $40,000 (dep + opex) a year per robot station.
Step 3: One station, 24 hours
The unit of analysis is not a robot but a sort station needing coverage around the clock. One stated assumption: the facility runs 24 hours a day with volume to absorb the output; true of major sort centers, not single-shift warehouses. This is a simplifying assumption, that will likely not hold true for most use cases, as most warehouses aren’t running high productivity 24/7. But this assumption will create easier math for us to follow.
The human crew needs three 8-hour shifts. Each yields about 7 productive hours after a 30-minute unpaid meal and two 15-minute paid breaks, the standard US hourly structure and the one the challenge followed.10 That is 21 productive hours, with 12.5% of the clock off-task. The robot pair holds all 24, giving up about 2% to swaps, already baked into its sustained rate.
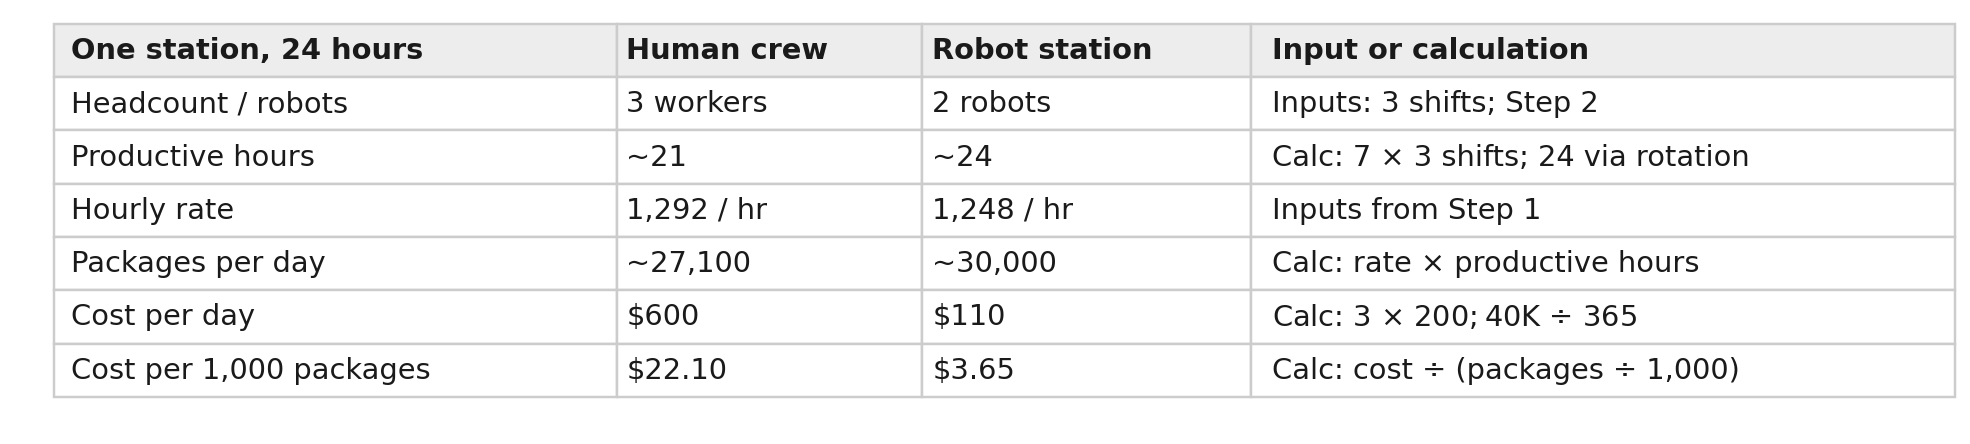
The daily comparison reduces to two factors, and the viral posts only saw the first:

The humans are faster, and it buys them almost nothing, because a 3% edge in rate is swamped by the 14% of the clock a crew necessarily spends on meals and breaks. Normalize the rates, and the daily comparison is that two robots can do the work of three humans.
Step 4: Gross it to a year: multiply the day by 365
The station runs 365 days, so annual economics are the daily economics times 365, with one adjustment per side.
Humans: coverage. Three shifts for 365 days is 1,095 shift-slots, and one worker delivers about 250 after weekends, holidays, and PTO, so staffing takes 1,095 ÷ 250 ≈ 4.4 people on payroll, not 3. There is no double count: 1,095 shifts × $200 is the same $219,000, because $200 per shift is $50,000 ÷ 250, and weekend coverage gets paid regardless, often at overtime rates.
Robots: downtime. I assume 96% availability: roughly 15 days a year (4% of 365) lost to robot maintenance, overhauls, and repairs, against a demo that proved eight days of continuity. Those days are netted out of annual output below. A third robot could buy them back, but roughly $10,000 of added depreciation to recover about $10,000 of output value is a wash, so the model takes the downtime. The human side keeps all 365 days because absences are already priced into the 4.4-head coverage math: you can hire coverage one shift at a time; you cannot buy two-fifths of a robot. Facility-level closures would idle both sides equally, so they cancel and are excluded.

The daily ratio was three humans to two robots, and weekend and holiday coverage stretches it to 4.4, or about 4.6 in output terms. The intern is a single data point, so sensitize his rate ±20% for experience and fatigue:
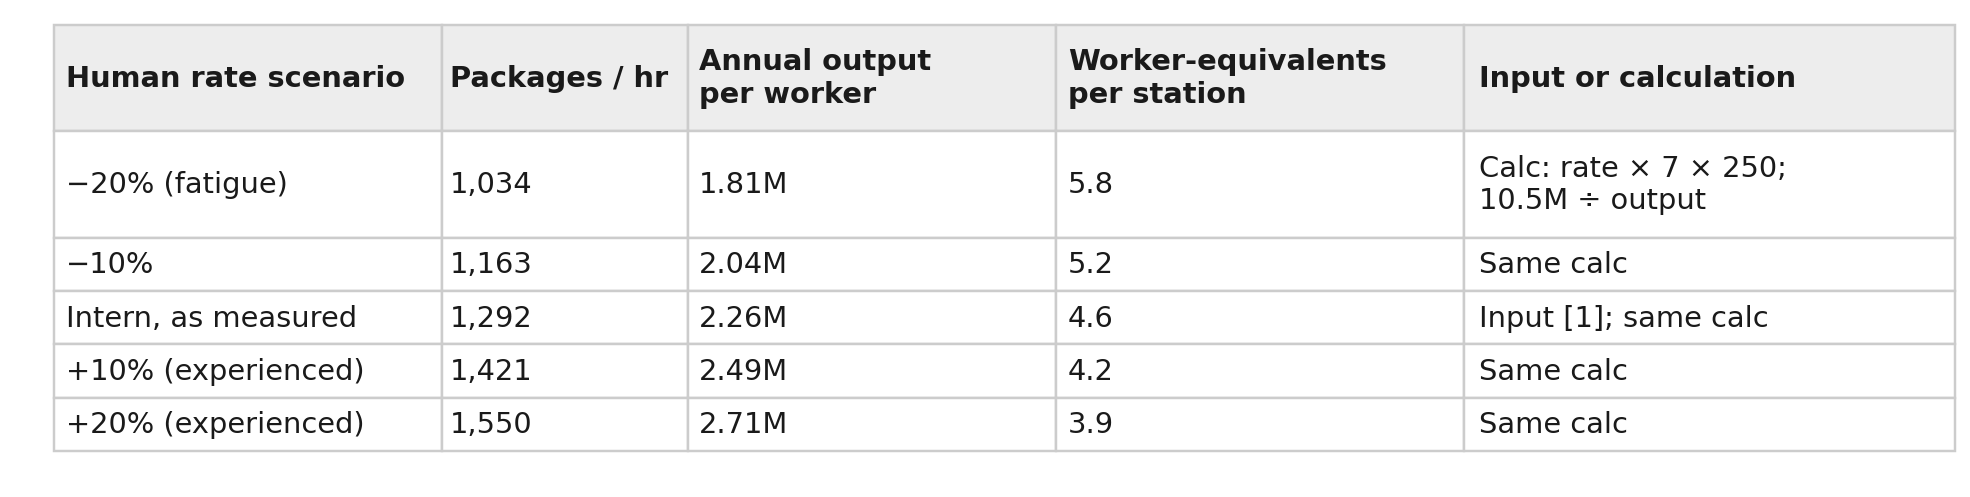
Even granting the human a 20% experience premium the answer is 3.9, and the posts celebrating the intern’s win were, without noticing, describing a pair of machines that does the work of four to six people.
Step 5: The per-station economics
Every component is now priced: $219,000 of annual labor savings from Step 4 against $40,000 of robot cost from Step 2.

Per package, that is 2.2 cents of human labor against 0.4 cents of robot cost. If anything the model leans against the robot: the savings are held flat while warehouse wages inflate, and sorting is physically punishing work with high turnover and injury rates, real costs to workers and employers alike that the model does not charge against the human column.
Step 6: The investment case in cash flow
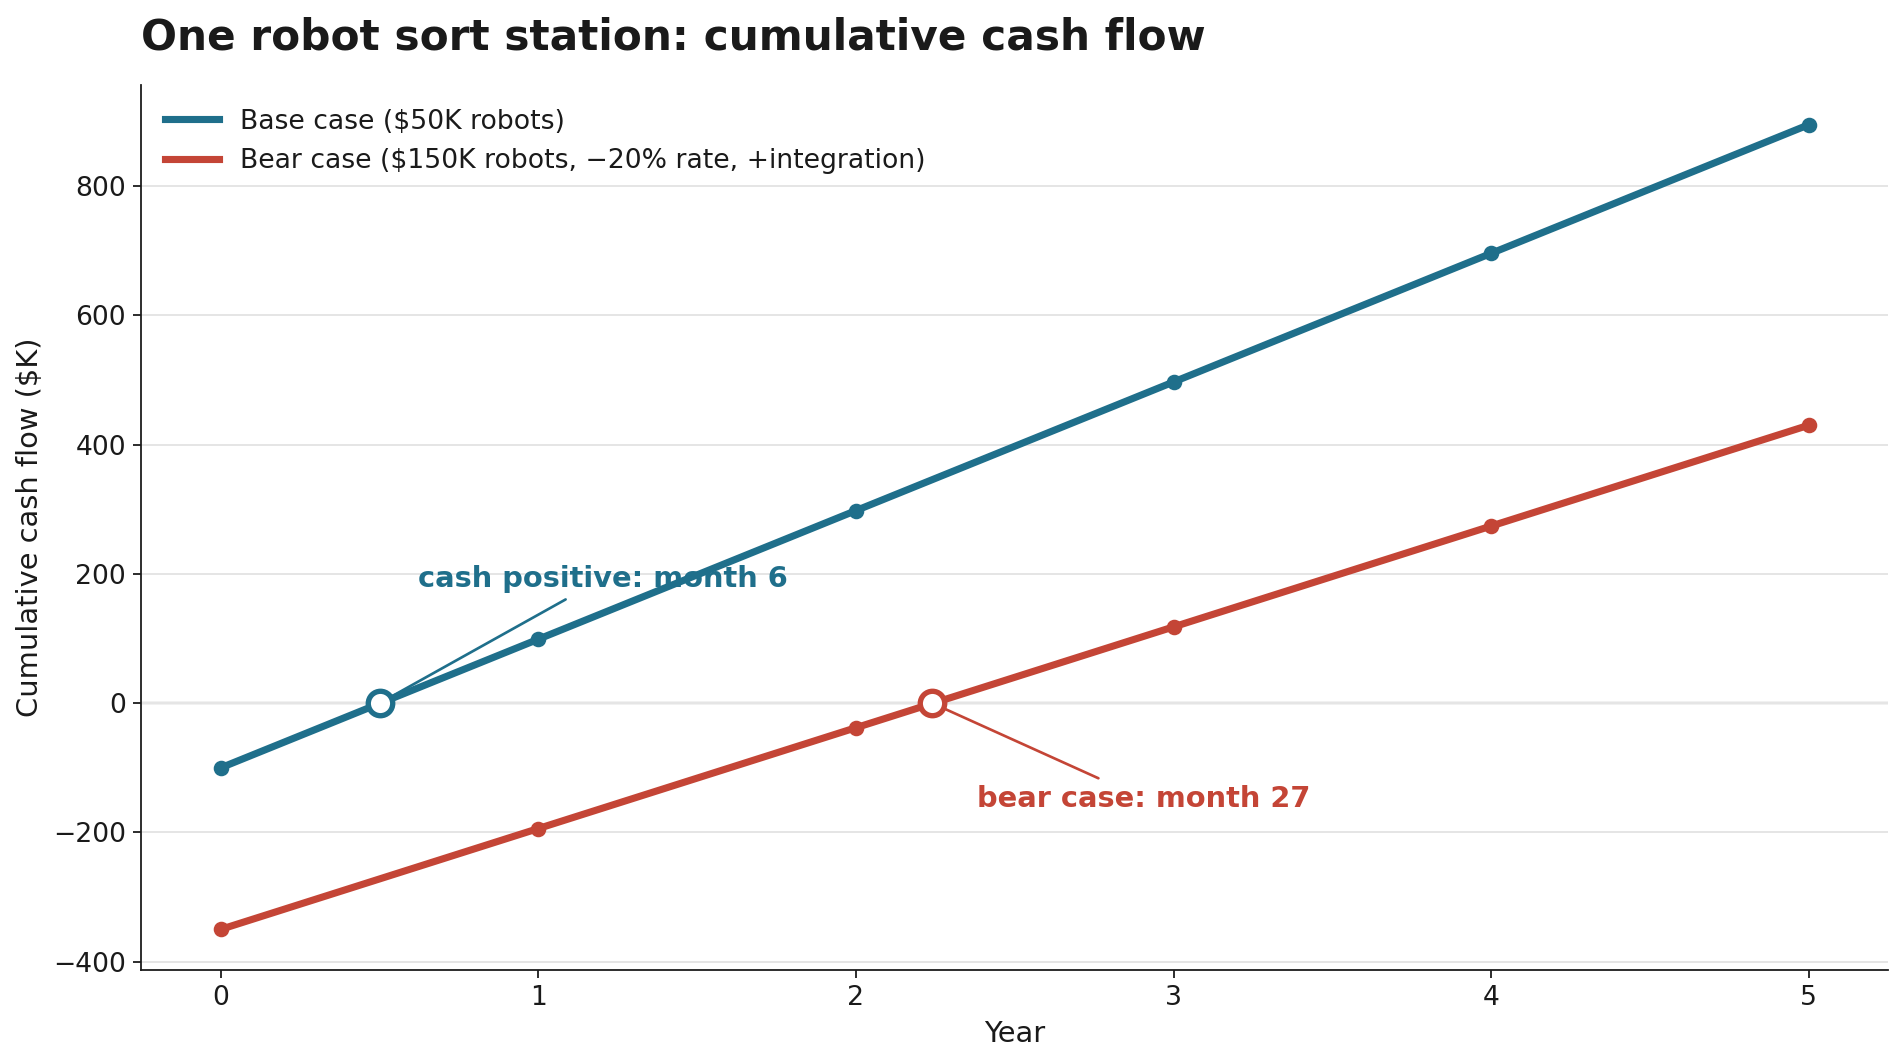
The operator writing the check thinks in cash: $100,000 up front for the two robots priced in Step 2, $20,000 a year to run them, $219,000 a year of labor savings.
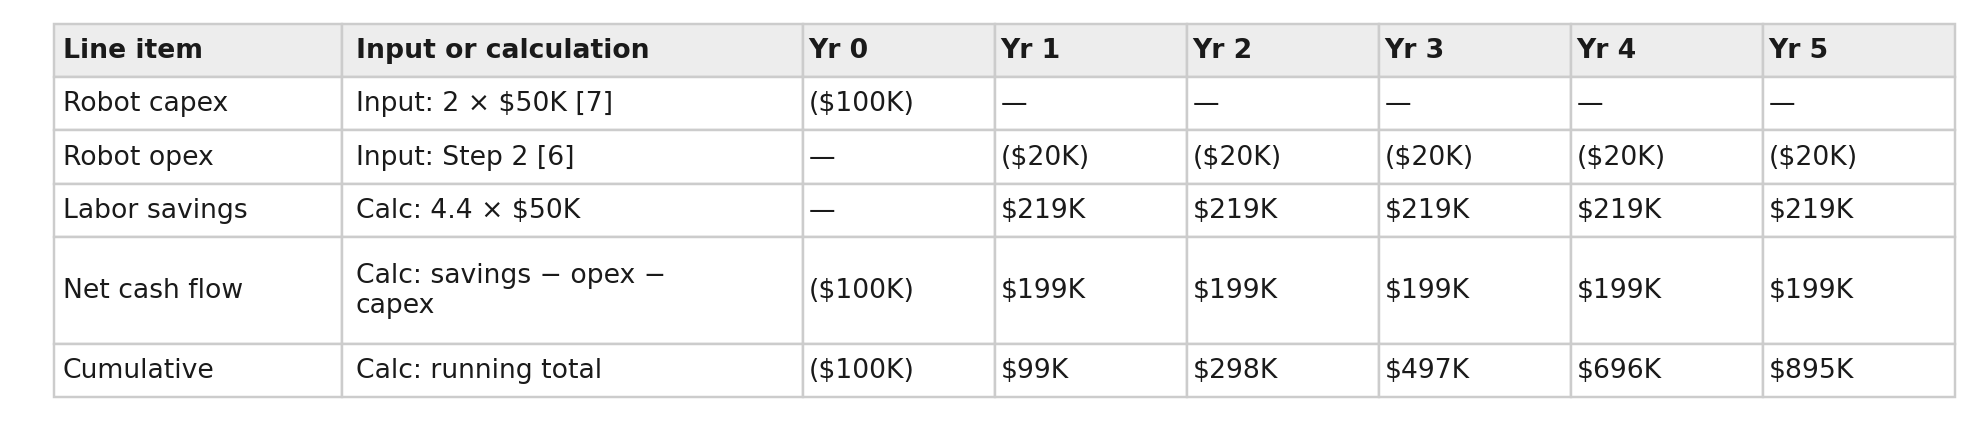
Cash positive in month six, all figures pre-tax. At a 10% discount rate over the five-year life, NPV is roughly $654,000 on $100,000 invested (math in the bridge table). And it survives stacking the bad news: $150,000 robots, throughput 20% below demo, $50,000 of integration capex, and $30,000 of opex still pays back in about 27 months with an NPV near $240,000. Very few capital projects clear their hurdles by margins like this.
Payback has two live wires, what you pay for the robots and the rate they actually sustain, so sensitize both together:

Calc: payback = (2 robots × price) ÷ (labor savings at rate − $20K opex); savings = output × $22.10 per 1,000, capped at the $219K crew cost. Opex held flat to isolate the two variables.
Two things stand out. Downside rate hurts more than upside helps, because savings cap at the crew cost actually avoided; extra speed earns nothing unless the extra volume has somewhere to go. And even the worst cell, expensive robots running 20% slow, pays back inside two years.
Conclusion: the method holds regardless of the inputs
If one number has to carry the conclusion, it is payback. At estimated prices, a station earns back its hardware in about six months. Stack the bad news instead, triple the robot price, cut throughput 20%, and add real integration capital, and payback stretches to about 27 months. Across the whole sensitivity grid, the range runs from about four months to 22. So the debate over exact inputs is really a debate about whether the machines pay for themselves in months or in a couple of years, comfortably inside a five-year life either way, and a 10-hour scoreboard has no bearing on any of it.
The method is what transfers: define the unit as a station, not a robot; anchor rates to one measured task; price every input before using it; build the day; gross to the year; net the economics; run the cash flow. Run your own numbers on each assumption; the bridge table below shows where every one comes from.
A closing caveat in the same spirit: this piece is an exploration of how to think about valuing a technology before it has a P&L, not a recommendation for this exact deployment. As an example; Manual-only sortation is increasingly rare, and for this specific process path a belt sorter or other fixed automation is probably the better price-for-performance bet. The framework earns its keep on the tasks fixed automation cannot reach, and on whatever technology shows up next without a P&L.
None of this math says anything about the people. Automation transitions have historically shifted work rather than simply deleted it; moving work toward exception handling, fleet operations, and maintenance, but that shift carries real costs for real workers, and pricing the economics is not the same as dismissing them.
That is how I value something that does not have a P&L yet. The next data points that move this model are a published price and multi-month throughput from a paying customers, including learning times, ramp and specific task outlines. And the next time a clip goes viral because a human edges out a robot over a single shift, it is worth asking what the scoreboard was actually measuring.
Risks and opportunities
The data. The run used small parcels in a narrow size and weight band on a curated line; Figure published throughput, not error rates, and the best accuracy datapoint, about 95% first-pass barcode orientation, is a generation old.11 At 20% below demo throughput the station covers 3.7 worker-equivalents instead of 4.6; the model survives that, but not a 50% gap, and nothing published rules one out. The human side is one intern and one shift, bounded by the ±20% sensitivity. And the rate itself cuts both ways: it was run by the vendor on a task the system was trained for, but it is also the earliest public point on a steep curve, with Figure’s published handling time falling from 5.0 to 4.05 seconds per package in three months before the challenge ran at 2.83. The robot’s rate sits on an improvement curve; the human’s is already near its ceiling. The model prices the snapshot, and the improvement comes free.
The machine. With the pair splitting the clock, a five-year life implies roughly 22,000 duty hours per robot, and no humanoid has demonstrated that. The operating line carries an overhaul reserve, but if joint life lands at the bottom of the harmonic-drive range, robot life shortens and payback stretches; this is the assumption a paying customer’s maintenance log should test first.
The deployment. The model assumes round-the-clock volume; on a single shift the hours advantage vanishes and the capital idles 16 hours a day. Many high-volume facilities already run fixed automation, cross-belt sorters whose per-package costs can beat humanoids, so the sharper fight is where fixed automation does not fit: odd flows, brownfield sites, work that moves around the building. Exception handling, systems work, and layout changes will push early deployments above the $20,000 operating line before scale compresses it; the bear case carries $50,000 of integration capex, and real deployments will discover the true number.
The commercial terms. The $50,000 base case is an industry estimate, not a price sheet; the bear case stress-tests it, and what price really changes is how fast the market opens. Three more unknowns sit outside the tables. Day-one parity: the model assumes challenge-level performance immediately, while Figure has said its first customer use case took 12 months to stand up and its second took 30 days.12 The software stack: licensing and model-subscription fees beyond the $20,000 line are unpriced, and so is who owns the operational data the robots learn from. And ownership structure: I model an outright purchase; a lease or robots-as-a-service contract converts capex to opex and dissolves the payback question into a monthly rate.
The views and analysis here are mine alone, built entirely from public information, and do not represent the positions of my employer. Nothing here draws on non-public information, and none of it is investment advice.
Bridging the sources to the model
No source hands you a model input directly. This table shows the bridge from each source figure to each model input, so you can audit, and move, any of them. Bracketed numbers refer to the footnotes.
Brett Adcock (Figure founder/CEO), X post, May 18, 2026: challenge results — intern 12,924 packages (2.79 s/pkg) vs. F.03 12,732 (2.83 s/pkg); robots rotated during the shift; challenge followed California meal- and rest-break rules. As reported by Sherwood News and Humanoid.guide: https://sherwood.news/tech/figures-robots-just-sorted-packages-for-200-hours-straight/ ; https://humanoid.guide/figure-ai-humanoid-robot-nearly-matches-intern-in-sorting-test/
Sherwood News, “Figure’s robots just sorted packages for 200 hours straight,” May 22, 2026: 249,560 packages over 200 hours, no failures, no humans in the loop; battery swaps roughly every 3–4 hours via walk-off/walk-on rotation; three robots covered the station. https://sherwood.news/tech/figures-robots-just-sorted-packages-for-200-hours-straight/
Figure, “F.03 Battery Development”: 2.3 kWh pack, ~5-hour runtime, 2 kW inductive charging. https://www.figure.ai/news/f-03-battery-development
US Bureau of Labor Statistics, OEWS/OOH, Laborers and Freight, Stock, and Material Movers, Hand (53-7062): ~2.9M employed; median annual wage $37,680 (May 2024). https://www.bls.gov/oes/current/oes537062.htm ; https://www.bls.gov/ooh/transportation-and-material-moving/hand-laborers-and-material-movers.htm
US Bureau of Labor Statistics, Employer Costs for Employee Compensation: wages and salaries average ~69–70% of total compensation for private industry, benefits ~30–31%. https://www.bls.gov/ecec/
Author assumptions, each bridged in the table at the end: 2 robots per station (whole-unit purchase); 24-hour, 365-day operation; 96% station availability; $20K/yr station operating cost; 250 shifts per worker-year; $50K fully-loaded labor; 10% discount rate and 5-year horizon for NPV; bear-case stress inputs ($150K price, −20% throughput, $50K integration capex, $30K opex).
2026 humanoid robot price roundups (no official Figure price published): F.03 commercial estimates $30K–$50K. https://theresarobotforthat.com/blog/humanoid-robot-cost-roi-breakdown/ ; https://blog.robozaps.com/b/humanoid-robot-cost
Humanoid and industrial robot maintenance benchmarks: preventive servicing every 3–6 months in high-duty environments; ~$5K–$15K/yr for commercial humanoids incl. actuator servicing; batteries every 2–3 years; industrial norm 5–15% of purchase price per year. https://www.futurobots.com/humanoid-robot-lifespan-maintenance-guide/ ; https://robotomated.com/learn/cost/robot-maintenance-cost-annual
Actuator and reducer life: harmonic drives rated ~10,000–20,000 hours by torque class, flex-spline fatigue under cyclical load is the primary failure mode; reducers are 15–25% of robot BOM; industrial robot MTBF ≈ 62,000 hours. https://www.evsint.com/industrial-robot-reducers-harmonic-cycloidal-rv-comparison-2026/ ; https://www.firgelli.com/pages/humanoid-robot-actuators
Break structure: no federal break requirement (FLSA); California DIR meal-and-rest-period rules (30-min meal, 10-min rests); two 15-min paid breaks reflects common employer practice. https://www.dir.ca.gov/dlse/faq_mealperiods.htm
Figure, “Scaling Helix: a New State of the Art in Humanoid Logistics” (June 2025): 4.05 s/package handling, ~95% barcode orientation success on the prior-generation system. https://www.figure.ai/news/scaling-helix-logistics
Figure (@Figure_robot) on X, February 2025: “Our first customer use case took 12 months, our second customer use case took just 30 days.” https://x.com/Figure_robot/status/1894781226676064459